
Why Mathematical Modeling?
Models merge biology, surveillance, and assumptions to project trajectories and compare interventions. They clarify what drives outbreaks and which levers matter most.
Integrates Knowledge
Links host, vector, environment, and control actions into a single, testable framework.
Evaluates Interventions
Quantifies impact of vaccination, isolation, quarantine, movement control, and biosecurity.
Explicit Assumptions
Assumptions about mixing, recovery, and contact patterns are transparent and testable.
Handles Uncertainty
Explores best/worst/likely scenarios via parameter ranges and stochasticity (if enabled).
Supports Decisions
Compares strategies for cost-effectiveness and feasibility in the field.
Answers Complex Questions
Reveals dynamics not easily visible from surveillance data alone.
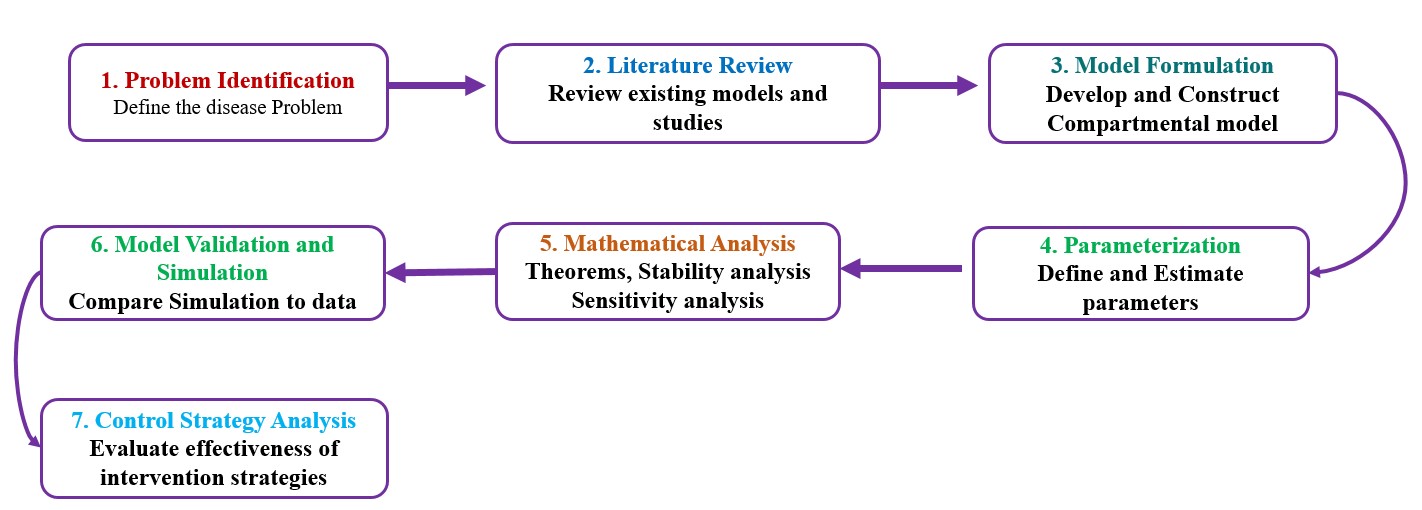
Modeling Workflow Steps
The following diagram summarizes the seven key steps in developing a mathematical model for disease dynamics — from problem definition to control strategy evaluation.
1) Problem Identification ▾
- Define the disease problem clearly (e.g., specify the pathogen, host population, and transmission routes involved).
- Identify key objectives — e.g., understanding spread, estimating parameters, or evaluating control strategies.
2) Literature Review ▾
- Review existing models and related studies.
- Identify gaps, model assumptions, and relevant epidemiological findings.
- Collect available data sources and parameter estimates.
3) Model Formulation & Parameterization ▾
- Develop a compartmental structure (e.g., SIR, SEIR, or extended models).
- Construct a compartmental diagram showing disease progression and transitions between compartments, and also the effect of environmental parameters.
- Translate the diagram into a system of ordinary differential equations (ODEs) representing population dynamics.
- Define all parameters (e.g., transmission rate, recovery rate, mortality rate).
4) Mathematical Analysis ▾
- Derive theorems related to the existence, uniqueness, and positivity of solutions.
- Determine disease-free and endemic equilibrium points.
- Perform stability analysis using Jacobian matrices or Lyapunov functions.
- Conduct sensitivity analysis to identify key parameters influencing disease spread.
5) Model Validation & Simulation ▾
- Implement simulations using real-time data.
- Validate the model by comparing simulated outcomes.
- Calibrate parameters as needed to improve fit.
6) Control Strategy Analysis ▾
- Introduce control measures (e.g., isolation, vaccination, treatment, culling).
- Determine thresholds: when to act, how much to deploy, and which mix is best.
- Assess combined interventions and cost-effectiveness.
7) Results & Interpretation ▾
- Present key findings (e.g., reproduction number R0).
- Provide insights for policymakers or field application.
FAQ
What data do models use?
Case counts, sero-surveys, movement, demographics, climate, and literature-based biology (latent/infectious periods, vector traits).
How are results validated?
Compare predictions to held-out data, check interval coverage, and run posterior predictive checks.
What about uncertainty?
Show credible intervals and scenario ranges; use sensitivity analysis to rank influential inputs.
Can I export results?
Yes—use the Simulation dashboard to export time-series and scenario comparisons.